
I was recently invited to participate in a round table at Google’s NYC headquarters which centered on a presentation by two informatics professors from UC Irvine reporting to the Google Docs team about their development of DocuViz, a new Google App. DocuViz “visualizes how a document evolves in Google Docs, showing who did what and when. It is a picture of the revision history over time” (Wang et al, 2015).
During this meeting, I felt what I imagine our students feel on a daily basis: I was lost in a sea of new language and ways of thinking. I was called on to describe my experience using this tool (and, more broadly, my understanding of writing) to a room full of experts listening very carefully to what I had to say. I hoped I would not mess up this opportunity. I was one of only a handful of people who had used DocViz in the classroom, and the first to give the tool to students to help them learn more about how they write.
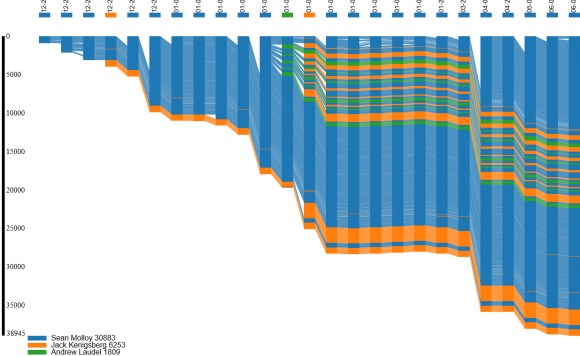
Figure 1 – Visualization of collaboration on common teaching goals
In this image we see how Sean, Jack and I collaborated to draft common teaching goals for our writing classes. You can see our pattern of adding new text and ideas to the top of the document to minimize scrolling. Sean initiated the pilot and the document itself, and his guidance is seen in the patterns of collaboration here through significant sections of blue. Especially interesting is the insertion of text by Jack and me between revisions 11 and 12 (noted by the appearance of orange and green text in the middle of blue). Looking at the visualization itself does not reveal what prompted our increased collaboration, but the map guides an analysis of the document itself. The activity between revisions 11 and 12 was prompted by our effort to work together and write course goals for our pilot – we each wrote, commented on, and rewrote versions of these goals. Since this work was on a sentence level, as opposed to word or paragraph levels, we see relatively thick strands of color variation. If revision was on a word level, we would see individual strands of color; if it was on a larger level, we would see larger chunks of color variation.
My class was part of a “Writing About Writing” pilot program in Hunter’s English Department in which we taught first-year writing as a writing theory class where students practiced different ways of thinking about writing and conducted research into their own writing processes. Students explored the fundamental questions: what do you do when you write, and why? The hypothesis of this model, as articulated by Downs (2010), is that only through improved metacognition can students carry with them what they learn about writing from class to class and from discipline to discipline (see also Snead, 2011).
As part of an ACERT Faculty Innovations in Teaching with Technology (FITT) grant, two English department colleagues (Sean Molloy and Jack Kenigsberg) and I, all teachers invested in this pilot program, were looking to use technology to facilitate the kind of writing students will do beyond the first year composition classroom and the undergraduate experience. Often, students are required to work together to write a class project (usually outside of the English classroom), or to collaborate at work.
I wanted to learn how to teach collaborative writing, but the question of how to assess group writing kept coming up. How can you tell who wrote what? Does it matter? Even more interesting for my particular approach to teaching and learning was: what kinds of decisions do writers make when they work together, and what do these decisions (including division of labor and revising the writing of others as a deadline approaches) tell us about how writing works and how we write?
To answer these questions, I spent time learning how to use and help my students interpret maps generated by DocuViz. I asked students to write their group projects, a case study assignment, in a single Google Doc. Students worked in teams of three to collect data for this case study, analyze their data, and shape it into a written report. Students produced a collaboratively written document that they could then analyze, in a subsequent assignment, for patterns of creation and revision.
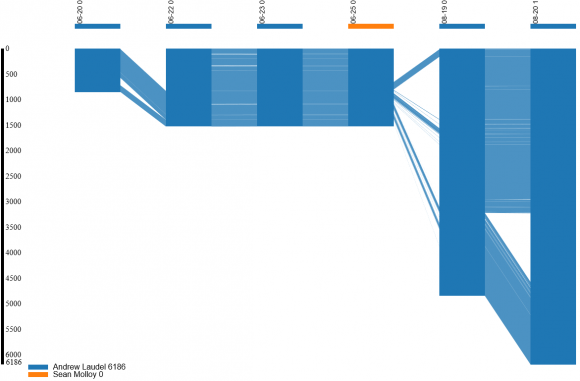
Figure 2 – Visualization of annotated readings for FITT project
The Annotated Readings document I wrote for the “Discourse Community Ethnography” provides an example of a document’s growth in response to shifting ideas and the feedback of others. I initially conceived of this document as a reading list which included readings for different units. After narrowing my focus to the concept of discourse communities and developing a clearer picture of the assignment I wanted students to do, I added readings which I felt served the assignment and deleted those that became irrelevant. You can see this process visually in the insertion of text at the beginning of the document between revisions 1 and 2 as I read a wide range of readings I thought might be useful. Between revisions 4 and 5, many changes occurred. At this point I had significantly narrowed my focus and many of the readings were no longer necessary. In addition, I was encouraged to annotate the readings I had chosen. The blue strands that connect revisions 4 and 5 represent the citation for the readings that I retained, and the addition of large chunks of blue text (paragraphs) show the inserted annotations.
There are many methodologies and tools for analyzing a writer’s process (from the simple writing log, to think-aloud protocols, to computer keystroke and video recording) that can help students understand why and how they write what they write. The DocuViz tool is a novel contribution to this tradition; it proved both handy and challenging. I gave students graphs of their writing, taught the students how to read them, and allowed students the option of using these graphs as evidence to support claims they made about their writing in their reflections. The task gave students practice with metacognition and argumentation, the two big course objectives, all in one fell swoop.
Student feedback on the exercise varied. Some felt that the assignment, and the tool, was a little too technical. One student “became a little freaked out about Big Brother during the process” of analyzing her work because she did not like knowing that Google, or myself, could track her keystrokes and see all her group’s previous writing in the document. Others, however, viewed the graphic representations of their writing and revising processes as enlightening. They liked the clear visual depictions of what they may have sensed they were doing but could not quite understand or see.
The visualizations were especially helpful in giving students an idea of the scale of their revisions. As Sommers (1980) observes, larger scale revisions are much more common among experienced writers and quite challenging for students, who are more likely to think about writing in terms of sentences. Using DocuViz, students could see the difference between local sentence level revisions and the larger global revision of ideas and paragraphs.
One student observed that her graphs showed “heavy word and sentence level revision” as the deadline approached, and another noted “most edits that were made were word choices or sentence level changes” because, although “there were many large conceptual edits I wanted to make…I felt like I wanted to give the other members of my group a chance to edit.” Consideration of group dynamics and shared ownership made students sensitive to large scale revision.
Another student found the “exercises we did on documenting, observing, and analyzing our writing habits,” which included the DocuViz analysis, “were definitely beneficial. I liked using the DocuViz graphs” because they tracked her writing and thinking visually and made her more aware of her own agency as a writer.
DocuViz currently has limitations in terms of its usefulness for assessment, but I found it a powerful new tool for research into individual and collaborative writing processes (especially revision). As far as an instructor’s ability to use the tool to make inferences about who wrote what, DocuViz appears to provide evidence of individual authorship that, on closer inspection, may not hold up. Although each author’s actual keystroke contributions are color coded, the typing of the document itself does not necessarily capture the entire process of creating and writing that idea, paragraph, or sentence. Simply put, the tool cannot record what goes on in a room where writers are talking through ideas and sentence structures out loud or using another program, like Google Chat, to brainstorm or give feedback to each other.
One student noted that the DocuViz tool “did not include the [group member’s] suggestions that were discussed in our Googledoc,” group chats, or in other documents. That said, DocuViz does a good job of tracking the addition, subtraction, and overall movement of text in a Google Doc between writing sessions. This tracking is useful to researchers (both instructors and students) who are interested in learning more about how people work together and, by making revisions visible through capturing changes graphically, provides some concrete evidence of a writer’s thinking. This can help create conversations about why a writer makes the changes he or she makes.

ReferencesDowns, Doug. (September 2010). Writing About Writing Curricula: Origins, Theories, and Initial Field Tests, WPA-CompPile Research Bibliographies, No. 12. WPA-CompPile Research Bibliographies. June 9 2015. Snead, Robin. (December 2011). “Transfer-Ability”: Issues of Transfer and FYC, WPA-CompPile Research Bibliographies, No. 18. WPA-CompPile Research Bibliographies. June 9 2015. Sommers, Nancy. (1980). Revision Strategies of Student Writers and Experienced Adult Writers. College Composition and Communication, 31(4). 378-88. Wang, D., Olson, J. S., Zhang, J., Nguyen, T., & Olson, G. M. DocuViz: Visualizing Collaborative Writing. Proceedings of the Conference on Human Factors in Computing, CHI’15. 1865-1874. Additional Resources |
Image credits:
More (cropped) by FontFont. Used under a Creative Commons license.
Comments are closed.